


Transform Data Skills into Career Success.
Master Excel, SQL, Power BI, Python and AI-assisted analytics through live projects built around real business questions.
our top hiring companies






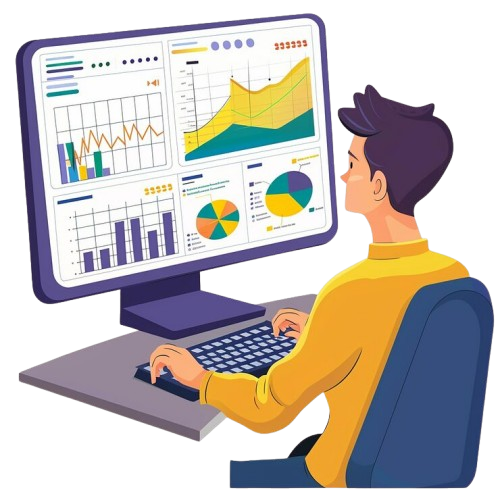
Why should you learn Data Analytics?
Businesses collect more data every day. The valuable professional is the one who can clean it, understand it and explain what decision should come next.
Learn it the right way
A few habits that separate learners who build real skill from learners who just collect tool names.
Do
- Start with the business question
- Validate data before trusting results
- Explain insights in simple language
- Document assumptions and decisions
Don't
- Confuse attractive charts with useful analysis
- Treat correlation as proof of cause
- Upload confidential data into tools carelessly
- Use AI output without checking the numbers
Program Structure
Excel Basics
Students will be able to confidently navigate Excel, manage workbooks and worksheets, enter and format data, and use basic formulas for everyday calculations.
Data Management
Students will be able to organize, sort, filter, and analyze datasets using tables, conditional formatting, and essential functions like IF, COUNTIF, and SUMIF.
Advanced Excel
Students will be able to perform advanced data lookups, connect and manage data across multiple sheets, and create PivotTables and PivotCharts for efficient analysis.
Analysis & Automation
Students will be able to visualize data, perform advanced analysis using Goal Seek and Solver, consolidate information, and understand basic Macros and VBA for Excel automation.
Who Is This Workshop For?
Marketers & Content Creators
Founders & Entrepreneurs
Working Professionals
Students & Job Seekers
Month 1 in detail: Excel Mastery
A closer look at the first 4 weeks. Months 2-4 continue with SQL, Power BI, Python and business storytelling.
Outcome: Students work confidently with Excel workbooks and structured data, use lookup functions and PivotTables for analysis, and understand the basics of Macros and VBA for automation - the foundation the rest of the program builds on.
Tools Covered of Masters in Data Analytics

Power BI

.png)
.png)
.png)


Masters in Data Analytics
Master the fundamentals of data analytics and learn how to use it for retrieval of business insights..
Not Just Studying
We’re Doing Much More!
Empowering Learning Through Real Experiences and Innovation
 Career Transition
 Career Gap
 Placement
Activities
Placement
Activities Placement
Drives
Placement
Drives Latest Hiring
 Whats App
Reviews
Whats App
Reviews








Get Downloadable Notes & Resources for Quick Revision

Easy-to-Understand Recording Videos
Clear, simplified recording videos that help you grasp concepts quickly and revise anytime.

Resources That Actually Build Skills
Assignments, modules & resources designed to help you apply what you learn.

Career Support
Our support team is available 24/7 to assist you.
Download Brochure
Get the full Data Analytics Training Program brochure with the complete week-by-week curriculum, outcomes and fee details.
 Download
Brochure
Download
BrochureHow will Priedutech help you?
8 Business Case Studies with Live Data
Build dashboards and reports on real business questions, not toy datasets.
Job Boards with 100+ Hiring Partners
Direct access to active analyst and BI openings from our hiring network.
Direct Just-in-Time Interviews
Get connected to live openings as soon as you're ready.
Referrals from Placed Analysts
Tap into a growing network of data professionals already hired.

Frequently asked questions
Everything you need to know about this program.
